
I received some Tour de France data from an online cycling website today. The data was in GPX format and it was a list of coordinates by stage. During the 2023 event, there was twenty-one stages starting in Spain and ending in France. Each GPX file is a sequential list of coordinates (latitude, longitude); each coordinate is in ascending order (yet without any sort identifier).
USE CASE- Combine all GPX datasets (by stage) for later use in Tableau:
- Convert downloaded gpx files to a compatible version for Tableau Public (csv)
- Some minor data manipulation to sort the stage coordinates accurately while also combining all stage data to one complete csv file
- Utilize spatial formulas to leverage coordinate data and calculate other relevant measures (distance calculated off two points)
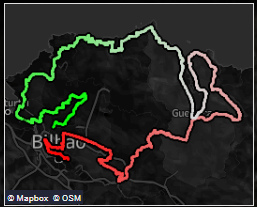
With the sequential data points, you should now be able to plot these points and get a map view of stage schematic.
Check out the workflow below:

I will break down the above workflow in 6 sections:
Input Stage
Query of input data (converted csv files) and union of those files to create one dataset. Record ID creation to sort all converted geo-points.

Data Clean-Up
Sorting and re-numbering of records by stage while also removing noisy data that I do not need.

Details
Use of Multi-Row Formula and Other formula actions
Use of the multi-row formula to create stage number identifiers in the fully unioned data set. Also used the ‘ST_CREATEPOINT’ formula that takes the numeric latitude and longitude points to create a geo-spatial point for plotting in Alteryx.

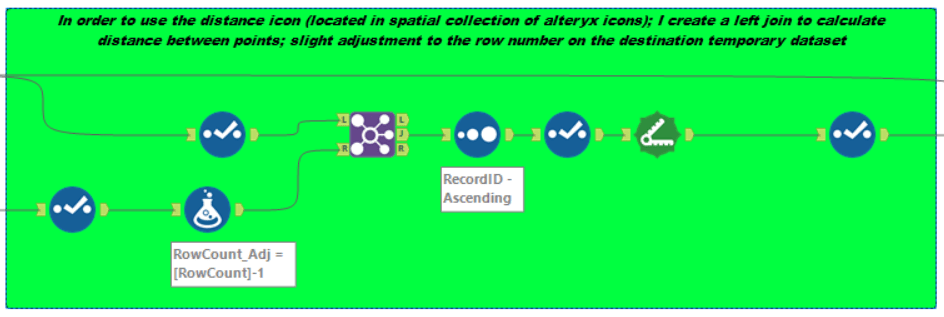
Leverage of spatial coordinate points and spatial collection formulas
Now that we have the outputted spatial points, we can leverage the distance formula to calculate distance between two points. Once we have all these distances, we can aggregate the distances by stage to get a total distance.
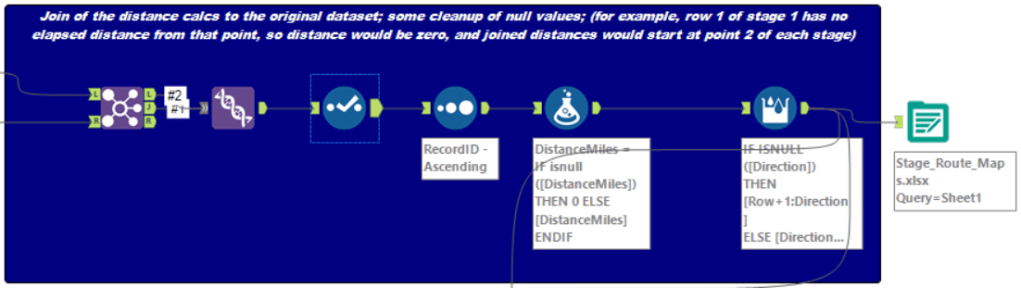
Post work clean up and prep
Join of the distance calcs to the original dataset; some cleanup of null values; (for example, row 1 of stage 1 has no elapsed distance from that point, so distance would be zero, and joined distances would start at point 2 of each stage)
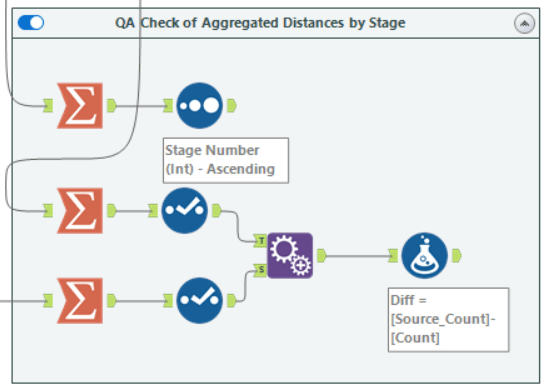
QA of executed actions
Using the summarize tool I was able to aggregate the ‘sub-distances’ to view total distance and compare to the Tour De France website stage distances listed.
In summary, we look back at our original data. We started with multiple gpx files, converted them to csv and used Alteryx to examine and add stage identifiers to all the map coordinate data. We also use spatial tools in Alteryx to create geo points and distances off those created map points. Below is a view of the created dataset in Tableau for Stage One of the 2023 Tour de France.
Check out the YouTube video below:
