
A waterfall chart is a type of bar chart that can explain net change of a measure from across all its contributing cohorts. This is a bar chart that is mostly used in the financial services industry. Analyzing change over time can show attribution of change to specific groups to the overall change of said measure.
You can use these types of charts to explain changes in sales over time; expenses; subscriptions, etc. When you are looking to drill into a specific variance over time, you can isolate the main drivers of the variance by dividing up those changes with a waterfall chart.
The picture to the right, shows a trading terminal that visualizes a stock performance in real-time. This in a way is a waterfall chart of the stocks value over a period time (or cohorts of time; time intervals).

Waterfall Creation: Using Tableau
Dataset: Superstore Data
Goal:
Create a waterfall chart that allows the user the ability to view overall sales from one year to another; while also seeing the change of sales by sub-category. Also, add additional filters to the waterfall that makes it more versatile allowing for additional cuts and/or views.
Calculations Created:
- Year A Total: Total Sales for a selected year
- Year B Total: Total Sales for a selected year
- Year Change: Difference of Year B to Year A
- % Change: percentage of year change by each component (sub-category)
Parameters Created (based on Order Date; formatted as custom ‘yyyy’):
- Year A
- Year B
To follow me through the creation of the above calculations/parameters, check out this link here
Okay! Now we have our necessary components to build our waterfall. Let’s begin!
The waterfall is going to be a combination of a sized gant chart and bar chart; I will show you how to incorporate parameters to dynamically change your comparison points for the waterfall chart.
Build standard Gant chart using the change in sales (calculation created from above):
I drop the ‘year change’ calculation to the rows pane and sub-category dimension to the column pane. On the year change continuous pill; I changed the quick calculation to running total and then changed the mark type to Gant Chart. Lastly, I placed the year change measure to the size mark which adds size to each Gant Chart mark.
In the size mark; I added a negative sign in the size pill (double-clicked on the green pill and added a negative sign in the beginning); this flips the Gant Chart marks; this is good because negative marks will lower the running total; this makes the view functionally tighter when we see the chart at the end. I also added another year-change pill to the color mark and created a custom diverging color palette with two steps and the value of zero as the center (red=negative; blue=positive).

I added a second measure; Year A Total Sales. I added this to the row pane which now splits your screen to two separate charts. I also removed pills in the marks pane associated with the Year A Total Sales measure and changed the chart type to a Bar Chart. I do this to show you that if we overlay the Gant Chart change to the Fixed Year A Total Sales, we can add a start/end point of that waterfall chart.
The below image will show how I modified the Gant Chart change marks to be a running total of change by sub-category while also taking into consideration the start point of sales measure (Year A).
I double clicked on the year change pill in the row pane and added the following (+ sum(Year A Total Sales)). This will adjust the Gant Chart to show a running total starting at the sales measure of the YEAR A (parameter to be user selected). I then created a duplicate pill (Ctrl + drag of the original pill) to the row pane. This will give two Gant Charts, I changed one to Bar chart and the other remains as Gant Chart. I am now able to create a dual axis chart, synchronize axis and place the Gant Chart mark over the Bar Chart to show the sub-category change over the current sales performance.
I can now create a Dashboard with a horizontal container object, placing three views in the object: Year A Total Sales, Sheet (showing change by sub-category) and Year B Total Sales.
This now gives the user some additional visual context of each cohort sales change between Year A and Year B.
You can now tweak the view to confirm the dashboard is more user interactive. Here are a few things I did:
- Modified the bar chart color transparency; only needed for visual context so a change to the transparency would bring more attention to the waterfall changes in sales
- Adjusted all the tooltips to call out the sales change by sub-category, % of total change to each individual sub-category
- I also added the parameter selections to act as bar chart labels to the YEAR bar charts
- I brought in the year parameters as filters in the dashboard as well as filters for Region and Category so that the user can easily change Year comparisons and filter down to specific regions and/or category combinations.
You can view the dashboard I created and tweaked here:
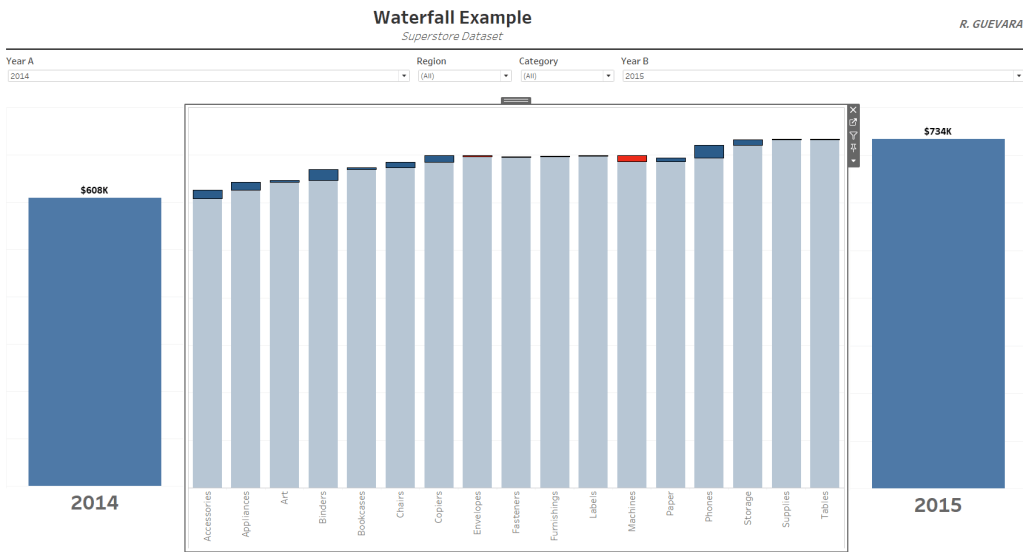
I like how you can see the shift/change in sales from Year A to Year B (2014 to 2015 in the screenshot). One thing that I did was assess the superstore dataset and review the max sales by year; this allowed me to fix the axis for all three views above to visually connect the change view to the year bar charts. If I did not fix the axis max, then filtering would show some disjointed views if there is a large disparity between both Year A and Year B sales.
How can I dynamically fix this issue without adding a fixed ceiling to the axis?
Any feedback would be greatly appreciated!
Feel free to follow me below as I walk through the steps in this short video:
